Custom Tiles or Custom Data Tiles feature on InfinCE lets you extract business data from different sources to visualise and track them on the dashboard. Data can be from business applications within InfinCE, CSV or Excel data in your Files or from external API/JSON data. You can choose your ideal data representation from a growing list of chart types.
Creating a new Custom Tile – Overview
- To create a Custom Tile, click on the “+New” >> “Tile” option on the top right side of the dashboard on which you desire to view the Tile. Alternatively, you could also start by adding it on to your private dashboard and insert it on the Org/Organizational Unit/Team dashboard once its fully customised.
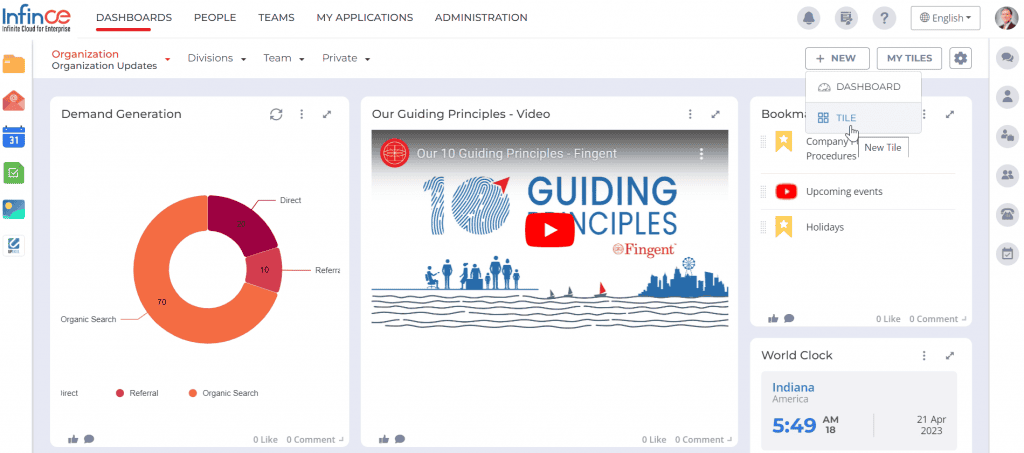
- Click on “Create New Tile” under “Custom Tiles” menu on the left. Choose the desired Chart type and click on the “+Add”.
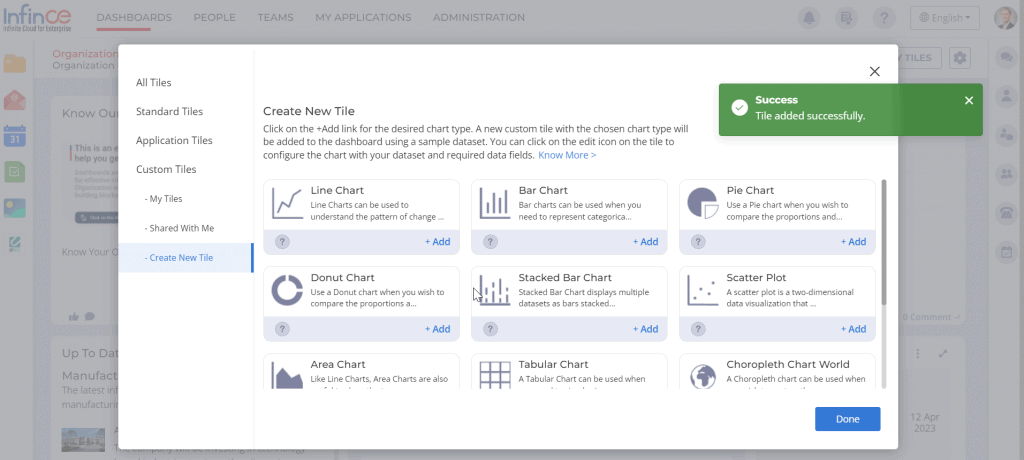
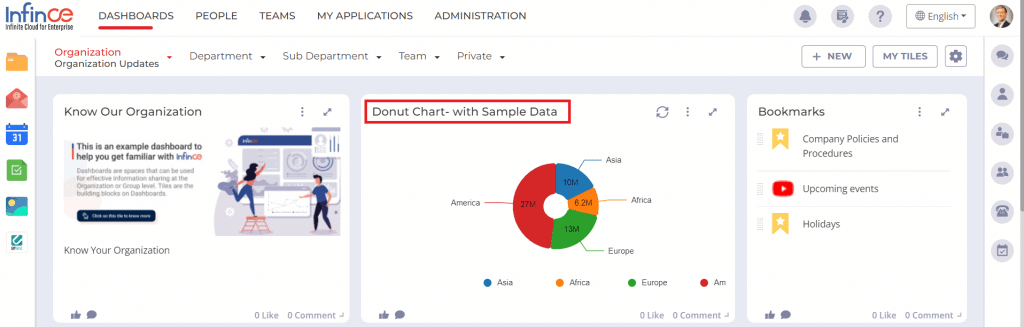
- A new Custom Tile with the chosen chart type will be added to the Dashboard using sample data. The Tile name indicates that this chart is powered by a sample dataset. Click on the configure icon (appears when you hover on the tile) to configure the chart/tile.
- The ‘Configure Tile’ screen will open up. The chart preview is shown in the centre.
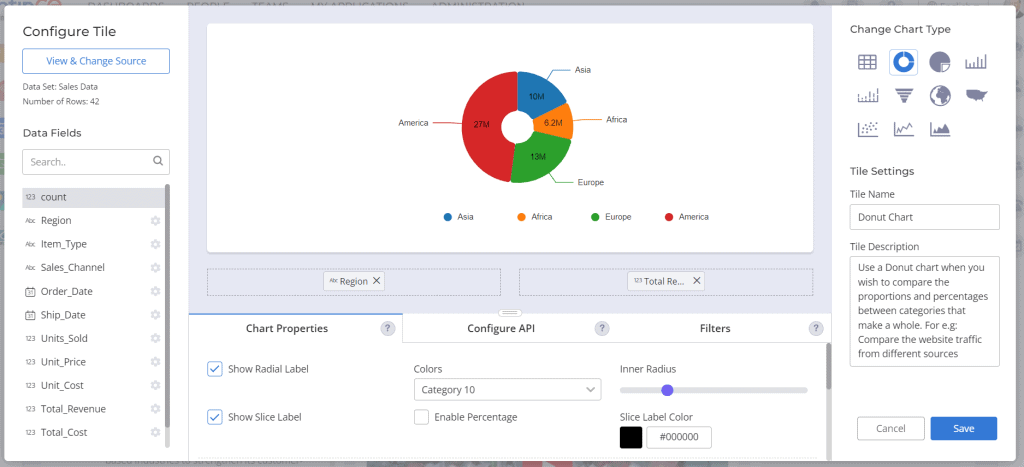
- On the left , you would have the options to view/change your Data Source and the list of all the Data Fields that can be used for visualisation. Click on each data field to view & modify its data type.
- Below the preview, you can adjust the chart display on the “Chart Properties” section or set the input parameters for API on the “Configure API” section.
- On the right, you have the option to switch to other Chart types. Below this, you can correct the Tile Name and Description as desired.
Each of these sections are described in detail below. Once done, click on “Save” to update the chart on the dashboard.
Changing the Data Source
The dataset being used by the current chart is displayed on the top left of the Configure Tile screen. By default, a new custom tile is powered by a sample dataset.
- Click on “View & Change Source” button on view/switch the dataset.
“Select Source” panel opens up. This panel lists all the sources you have created till date, with the current data source selected.
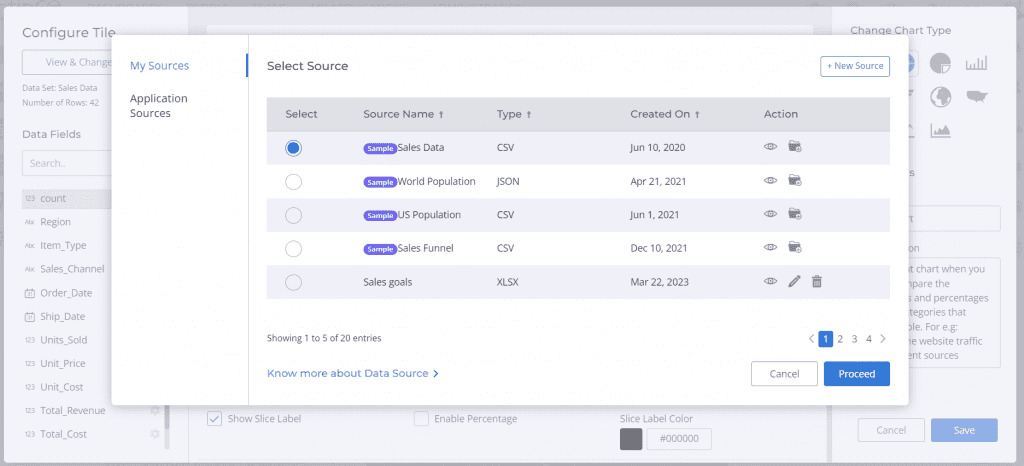
- Click on the “view” icon against the sample data set (CSV file) to download and view the data. Or, you could click “Add to Files” icon to save the sample file in your Files to analyze the data against the Chart.
- Click on “+New Source” button on the top right to connect your chart to a new data source. There are 2 kinds of data sources supported in InfinCE:-
- Application Sources, that allow you to choose APIs provided by Applications that you are provisioned to.
- Custom Sources like CSV/Excel on your Files or External API/JSON data.
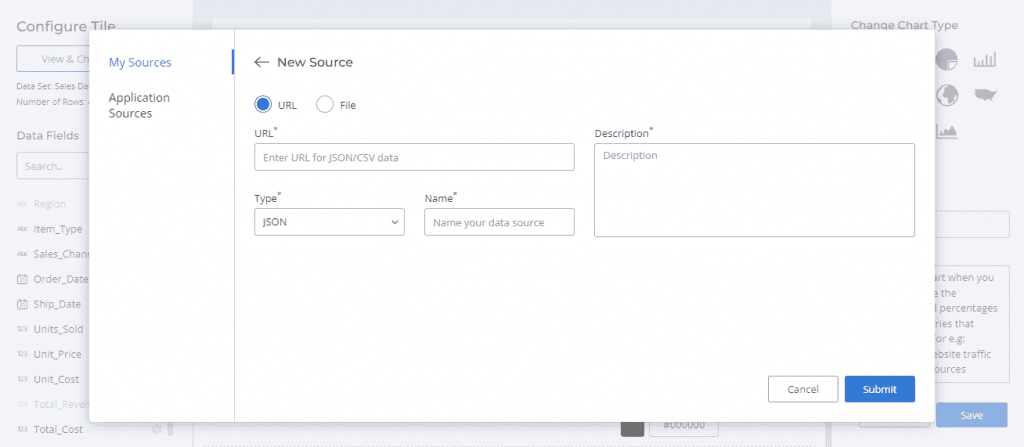
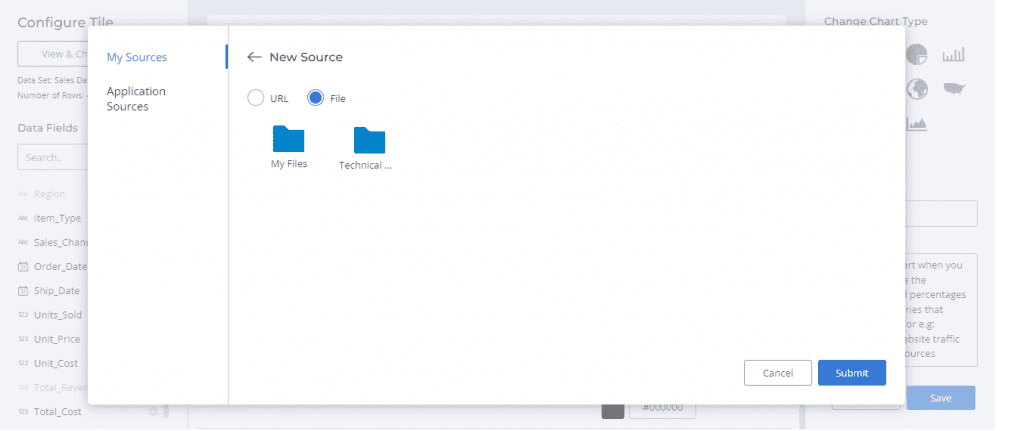
- Choose the data source and click on Submit to map the chart to this data. Any new data source that has been mapped will automatically get added to the “My Sources” listing for later use.
- Next step would be to drag and drop the desired data fields on to the Chart area. Click on the gear icon next to the data field if the data type has not been set correctly.
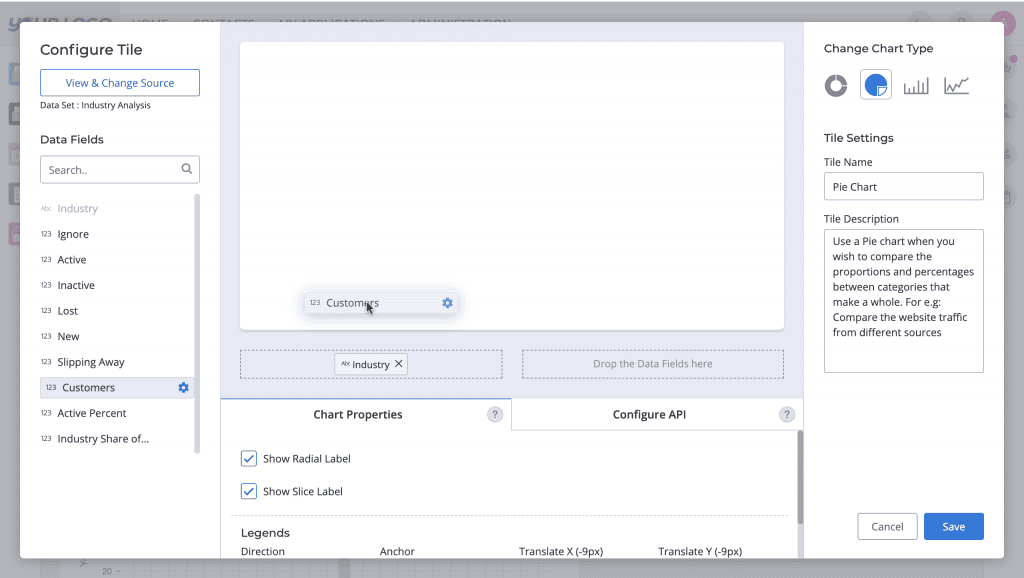
Chart Properties
Once you have set the source and the data fields required for the chart, you can customise the visualisation in the “Chart Properties” section below. Here you can set the labels on/off, adjust the orientation of the legends, position of the legends and so on.
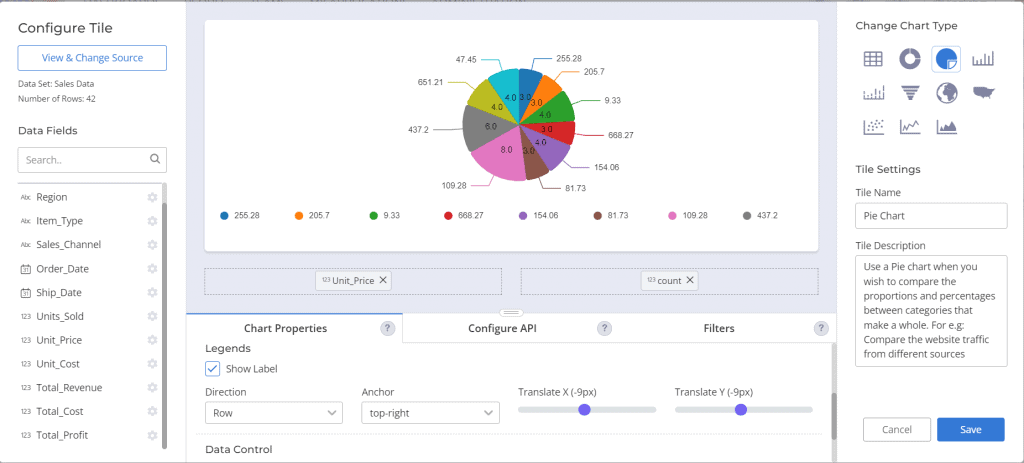
Adjust the labels and legends in the Chart properties section
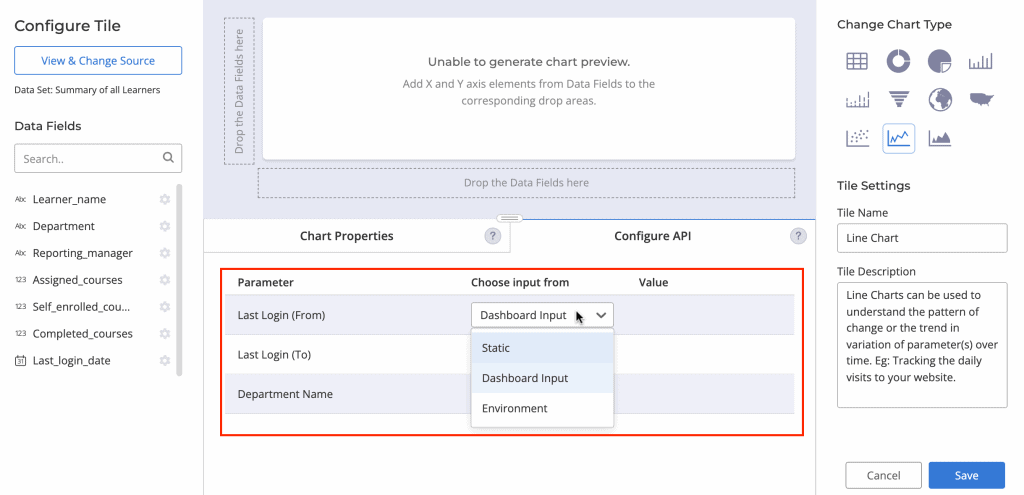
Configure API
If the data source is an API which requires input, there are 3 ways to feed the value for the input parameters. Use this tab to set the appropriate option.
- Static: With this option, you can set one static value for that input parameter and that would be used for every instance of the Tile in any dashboard.
- Dashboard Input: This option would let a user set the value dynamically from the dashboard. This would let you alter the filters as required and also to have varied instances of the tile for different filters.
- Environment: This option will allow you to automatically set the value from an environment variable. For eg; Mautic needs login Email as authentication for the APIs, so we can set the value to be fetched from the users email Id in the environment.
On the right side you have the option to switch the Chart Type. Provide an appropriate Tile Name and Description for future references and for reference of other users.
Once saved, the Tile would get automatically updated on the dashboard. You can again click on the edit icon if any more updates are required.
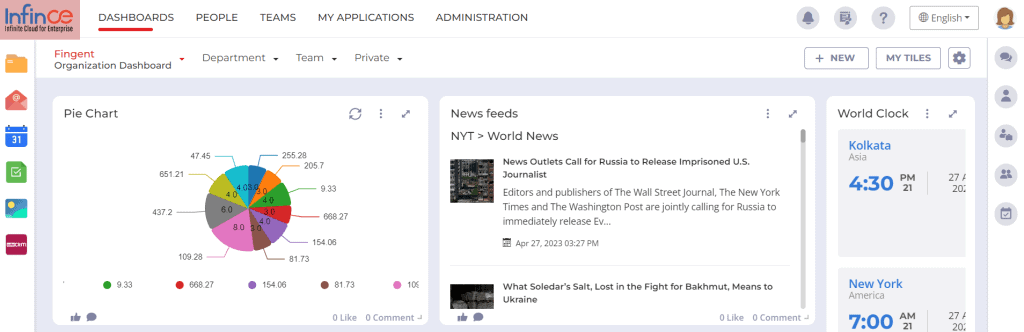
Updated tile on the Dashboard
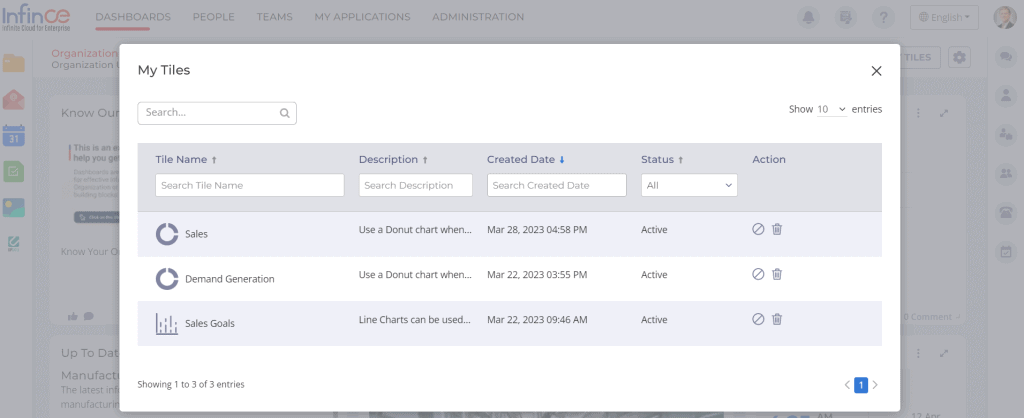
My Tiles
Every new tile that has been created will be available for you to manage, share, and delete. You can view this list of tiles by clicking on the “My Tiles” button on the top right of the dashboard. From this list, you can delete or deactivate any tile that you no longer need.
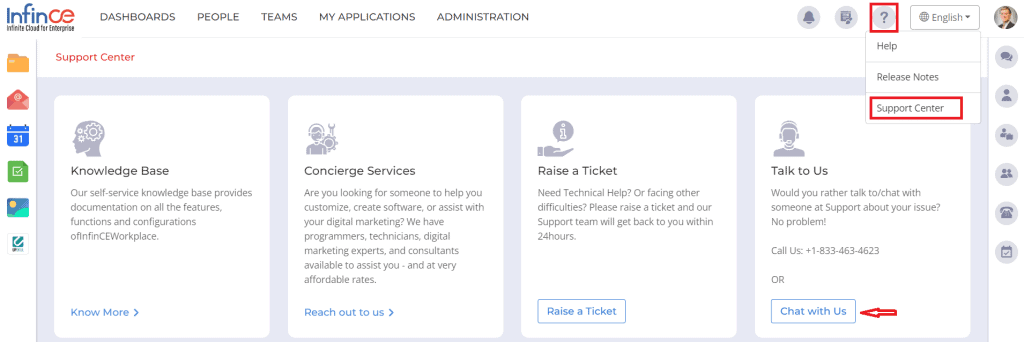
Need Support?
Want to know more about Custom Tiles and its possibilities? Chat with us from the Support Center within your InfinCE App and we can guide you further.